US commercial real estate transaction analysis – Q4 2024
A quarterly review of US commercial real estate transaction activity across all property types. This article is based on our commercial real estate investment trends and transaction volume report.

Key highlights
Transaction volume showed encouraging signs in Q4 2024, reaching $108.5 billion (33.6% increase from Q3) with the full-year volume of $369.8B representing the smallest annual decline since 2022, signaling the early stages of market recovery
Industrial and commercial general were the only sectors with positive year-over-year transaction volume growth in 2024, increasing 3.2% and 5.8% respectively, while other major sectors showed moderating rates of decline
Average price per square foot increased 2.3% annually across all sectors, with industrial properties showing the strongest appreciation at 9.4%, while multifamily experienced the largest decline at -2.3%
Regional variations are becoming more pronounced, with transaction activity increasing in the Southeast and Mid-Atlantic, while coastal markets are seeing price recovery faster than the center of the country
Despite high interest rates continuing to constrain transaction activity, market fundamentals remain relatively strong across most sectors, making US commercial real estate increasingly attractive as an asset class, particularly if interest rates eventually decline
US commercial real estate market: Q4 and full year 2024 in review
2024 was characterized by swinging expectations across US capital markets, including in commercial real estate. Domestic political uncertainty surrounding the Presidential election initially drove consumer and business sentiment, with a brief post-election boost quickly tempered by geopolitical concerns and uncertainty about the incoming administration's economic policies.
The year began with high expectations for multiple Federal Reserve rate cuts, only to see just 100 bps in reductions, far below initial forecasts. This "higher-for-longer" interest rate reality dramatically shifted market expectations throughout the year. Meanwhile, the ongoing tech sector disruption fueled both market excitement and volatility, pushing equity indices higher but creating a concentrated market that showed signs of instability by year-end.
For commercial real estate specifically, early optimism for recovery quickly faced the reality of persistent high financing costs. While transaction activity remained subdued compared to the previous decade, fundamentals stayed relatively sound across most sectors. Capital availability improved as non-bank lenders stepped in where traditional banks had retreated, with some banks showing early signs of returning to the market.
By the end of 2024, the CRE market began to show clear signs of early recovery, particularly in the fourth quarter, which saw encouraging transaction volume improvements. Looking back, 2024 marked the beginning of a measured recovery for US commercial real estate. Despite still-challenging conditions, investment activity and pricing appear to be finding their footing heading into 2025. The recently released US CRE Investment & Transactions Quarterly report explores these emerging trends in detail.
2024 transaction activity
Taking a look at transaction activity and the total dollar volume transacted. The final quarter of 2024 showed encouraging signs across all sectors, with total transaction volume reaching $108.5 billion in Q4, a significant 33.6% increase from Q3 levels, and a positive 5.8% rise compared to the same quarter last year. For the full year, 2024's total deal volume of $369.8B was down just 3.8% compared to 2023, marking the highest level of total dollar volume and the smallest annual decline since the end of 2022.
Total dollar volume of properties transacted
Source: Altus Group, Q4 2024 US Commercial Real Estate Investment and Transactions Quarterly report
Looking at the full-year 2024 data on a year-over-year basis, Industrial and commercial general saw the largest and only positive gains in terms of total traded dollar volume. Industrial saw more than $75B in transactions while commercial general reached $28B, representing increases of 3.2% and 5.8% respectively over 2023 volumes. With transaction volumes for office, multifamily, and retail down by 6-8% over the year, these sectors showed decreasing rates of decline throughout the year.
When examining transaction activity in terms of the number of properties traded, we see a similar trend of emergent recovery. In Q4 2024, 38,200 properties traded, up 5.3% from the third quarter. While this Q4 activity was down 5.7% compared to the same quarter a year ago and full-year 2024 transactions were also down 7.4% versus 2023, the annual pace of declines continued to moderate. If the current recovery and activity continues at a similar pace, we could expect to see the annual change in properties traded turn positive later this year.
Transaction volume statistics - Quarter-over-quarter and year-over-year
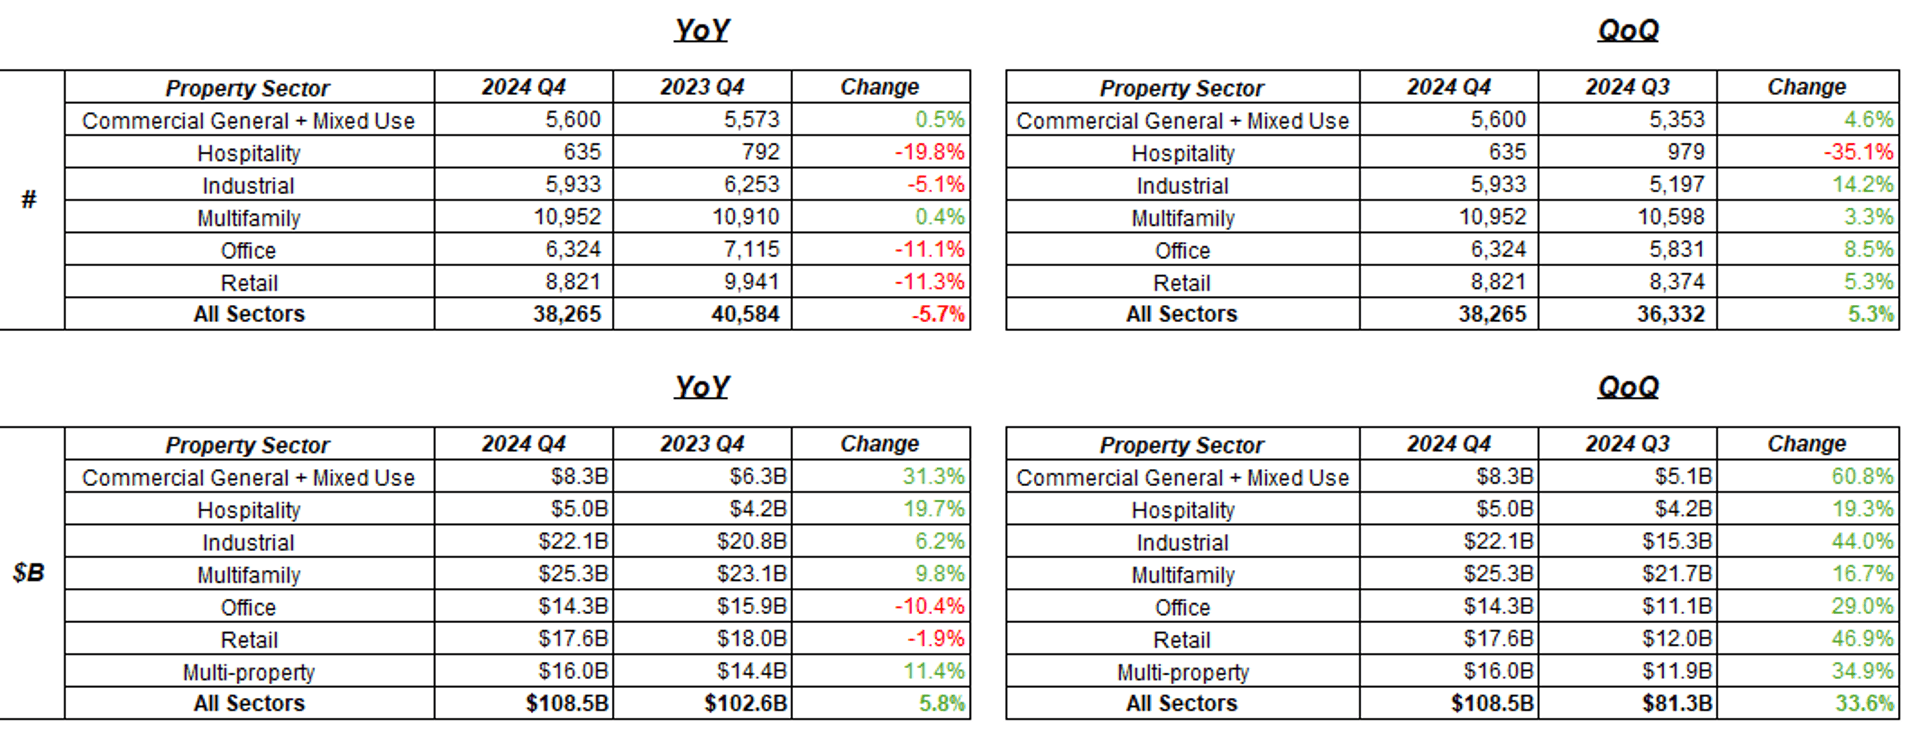
Looking more closely at the number of properties traded in 2024, hospitality and multifamily had the smallest year-over-year declines, each less than 3% compared to 2023, followed by commercial general and industrial, which had slightly larger declines of 4-6%. When comparing Q4 to Q3 data for 2024, we saw the biggest jumps in retail, industrial, and commercial general sectors, all of which saw their quarterly activity increase by more than the overall cross-sector quarter-over-quarter change of 5.3%.
Pacing and pricing trends
One of the most revealing aspects of our analysis is the pacing data, which shows transaction activity for the year as a running total compared to prior years. In terms of both the number of trades and dollar volume traded throughout the year, 2024 closely resembled 2014. Rather than suggesting the market is a decade behind, this indicates that the US CRE investment environment is in the early stages of recovery. Through 2024, there were approximately 345 daily transactions across the major property types within the US, about 12% below the 25-year historical average. In terms of daily traded dollar volume, 2024's $811M was 2% higher than the long-term average.
Cumulative count of properties transacted
Source: Altus Group, Q4 2024 US Commercial Real Estate Investment and Transactions Quarterly report
These simple averages only tell part of the story. Since not every property is valued or priced the same, it's important to examine pricing trends in more detail.
Looking at quarterly changes (Q4 2024 vs. Q3 2024), average price per square foot increased for all sectors except office, which saw a 1.3% decline. The "all sectors" average increased 0.7% for the quarter.
On an annual basis (Q4 2024 vs. Q4 2023), hospitality, industrial, and retail sectors all saw positive increases in average price per square foot, while commercial general + mixed use, multifamily, and office saw average prices decline. The largest decline was in multifamily, which dropped 2.3%, while the largest increase was in Industrial at 9.4%. The "all sectors" average increased 2.3% on the year.
Notably, 9 of 15 property subsectors saw positive average price growth per square foot in Q4 2024 on an annual basis, with the largest increases in big box retail (+32.3%) and limited-service hotels (+26.5%).
Pricing since Q1 2014
Source: Altus Group, Q4 2024 US Commercial Real Estate Investment and Transactions Quarterly report
Regional and metro performance
Regional variation is becoming increasingly apparent in transaction volume data. When comparing the change in number of properties transacted during Q4 versus Q3, we see increases in the Southeast and Mid-Atlantic, but decreases in the Northeast, Midwest, and Southern California relative to the national average. This pattern aligns well with trends in the single-family residential market. On an annual basis, we observe increases on the coasts and declines in much of the central United States relative to the national change. Similar trends emerge when examining total dollars transacted.
One significant development worth highlighting is the massive increase across all metrics (number of properties and dollars transacted) on both quarterly and annual bases across all Northern California MSAs, likely reflecting some value capitulation there that is thawing the markets.
In the Los Angeles MSA, across the four main property sectors, the median transaction price per square foot decreased for all but the retail sector, which saw a 20% increase from 2023 to 2024.
Of the 10 largest MSAs, median transaction price per square foot increased for all but Los Angeles, which saw just a 1% decline. Atlanta, on the other hand, saw a 21% year-over-year increase.
New York, Chicago, Philadelphia, and Atlanta saw increases across all sectors. The widest dispersion was seen in the retail sector, with median transaction price per square foot decreasing 25% year-over-year in Washington, but increasing 30% in Philadelphia.
Property sectors
Industrial
The industrial sector saw 22,700 properties transact through 2024 for a total of $75B. In the fourth quarter, 5,933 properties traded for $22B. While the number of trades in 2024 was down about 5.8% versus 2023, the dollar volume transacted was up 3.2%.
Using median values from transaction data to understand typical transactions, we can see a new trend emerging. The median size of traded industrial properties remained fairly consistent from mid-2014 to mid-2022, hovering between 17,000-19,000 square feet. Around the time the Fed started hiking interest rates, the median size of traded industrial properties began to fall, hitting 14,500 square feet in the first quarter of 2024. However, over the last three quarters through year-end 2024, the median size began climbing again and currently sits around 16,200 square feet.
Meanwhile, the average deal size in dollars has continued to climb, with the median transaction size reaching $1.6M in Q4, about 20% larger than the median deal size seen over 2021-2023. In terms of pricing within the industrial sector, manufacturing properties saw the largest year-over-year annual appreciation in transacted price per square foot, increasing 5.3% over 2023 levels, followed by storage which saw prices increase by 4.2%.
Multifamily
The multifamily sector saw more than 43,000 properties transact through 2024 for a total of $86B. In the fourth quarter, 10,952 properties traded for $25.3B. The number of trades in 2024 was down about 2.9% versus 2023, and the dollar volume transacted was down 6.8%.
On an annual basis, the median value of a single transacted property increased 16.4%; over the same period, the median square footage of a transacted single property increased 6.1%. Approximately 121 properties transacted on an average day in Q4 2024, matching levels from nearly a decade ago.
Office
The office sector saw more than 24,600 properties transact through 2024 for a total of $48.6B. In the fourth quarter, more than 6,300 properties traded for $14.2B. The number of trades in 2024 was down about 10.4% versus 2023, and the dollar volume transacted was down 8.5%.
Annually, the median value of a single transacted property increased 19.8%; over the same period, the median square footage of a transacted single property decreased 4.4%. Around 70 office properties transacted on a given day during the quarter, far below the typical pre-pandemic level of around 80.
The average price paid for office in Q4 2024 was $130/SF, 0.5% lower than the average price in Q4 2023. Pricing for the medical office sub-sector in the fourth quarter was $210/SF, up 4.8% from the same quarter a year prior. However, the full-year average price paid was still down 9.6% compared to the full-year 2023.
Retail
The retail sector saw more than 34,900 properties transact through 2024 for a total of $60B. In the fourth quarter, more than 8,800 properties traded for $17.6B. The number of trades in 2024 was down about 13.4% compared to 2023 levels, and the total dollar volume transacted was down 8.0%.
Overall pricing for the sector moderated through the year, as the average price paid for retail through the full year was $132/SF and $133/SF in Q4. Compared to 2023 figures, these were down 3.6% and up 1.2%, respectively. Across the various retail sub-sectors, anchor and other big box showed the most positive improvements in terms of pricing. The average transaction price of $108/SF in Q4 2024 for anchor and other big box, was up 9.5% compared to the prior quarter, and the full-year average price of $96/SF was up 1.6% on 2023.
On an annual basis, the median value of a single transacted property across the entire retail sector increased 10.2%; over the same period, the median square footage of a transacted single property decreased 1.1%.
Hospitality
The hospitality sector saw 3,300 properties transact through 2024 for a total of nearly $17B. In the fourth quarter, 635 properties traded for $4.9B. This meant that overall hotel transaction activity was 2-3% down from 2023 levels for the full year.
Looking at the median square footage of hospitality properties that traded over the year compared to prior periods, we can see that the size of hotels trading has largely remained consistent over time, unlike many other property sectors which have seen a broader trend of specialization and smaller property footprints. The typical hotel that traded in 2024 was about 35,000 square feet, 1.5% larger than typical in 2021-23, and only 3% smaller than typical since 2014.
That said, the price paid for these in square feet has risen, but unequally for full-Service versus limited-service properties. In 2024, the average price per square foot paid for limited-service hotels increased by more than 16% compared to 2023, while the price paid for full-service declined 2.7%. Limited-Service hotels closed the gap and removed the discount to full-service in Q1 2024 and traded at a premium, albeit very slight, to full-service throughout 2024, a trend worth watching.
Commercial general + mixed use
This somewhat varied, broad category saw some positive trends in Q4 and for full-year 2024. commercial general and mixed-use saw 21,700 properties transact through 2024 for a total of $28B. In the fourth quarter, 5,600 properties traded for $8.2B. While the number of trades was down 4.5% compared to 2023, the total dollar amount transacted increased 5.8% on the year. Looking at pricing trends within the sector, the price per square foot of mixed-use properties increased 2.2% over 2023, while pricing for commercial general declined by nearly 13%.
Conclusion
Through our other research, notably the CRE Industry Conditions and Sentiment Survey, we've seen that transaction intentions have been elevated since the start of 2024. However, these volume and activity statistics show just how challenging it is to fulfill those intentions in a high interest-rate environment. Nevertheless, recent numbers offer reason for optimism.
While looking at absolute levels of market activity may still seem discouraging, the rates of change tell a more promising story. The key takeaway from this report is that the CRE investment and transaction market is in the early stages of recovery. The direction is set, but the speed of recovery will likely depend on the financing environment. With the significant markdowns in CRE values since late 2022 and early 2023, coupled with still relatively strong fundamentals across sectors, US commercial real estate as an asset class looks increasingly attractive, particularly if interest rates eventually decline.
Looking at volume, we've begun to see annual increases in transaction activity, at least in terms of raw value. On a trailing four-quarter basis, the year-on-year change is nearly flat and seems likely to turn positive in the coming quarters, the inflection point is near. Interestingly, the number of properties transacting is still declining and the median size of transacted structures is decreasing, suggesting that much of the activity is being driven by high-value properties trading. What will be fascinating to watch is how the metrics change for each property type when physically larger properties start to transact again.

Author

Omar Eltorai
Director of Research
Author
Omar Eltorai
Director of Research
Resources
Latest insights

Apr 17, 2025
EP58 - From volatility to opportunity - AEW's Justin Pinckney on the CRE debt landscape